Hello,
After a bit of time and effort, I have managed to produce an office projects timeline, in Excel. Gantt charts are close, but they generally do not have multiple projects and they cascade the phases; rather than stacking them. Here's the result:
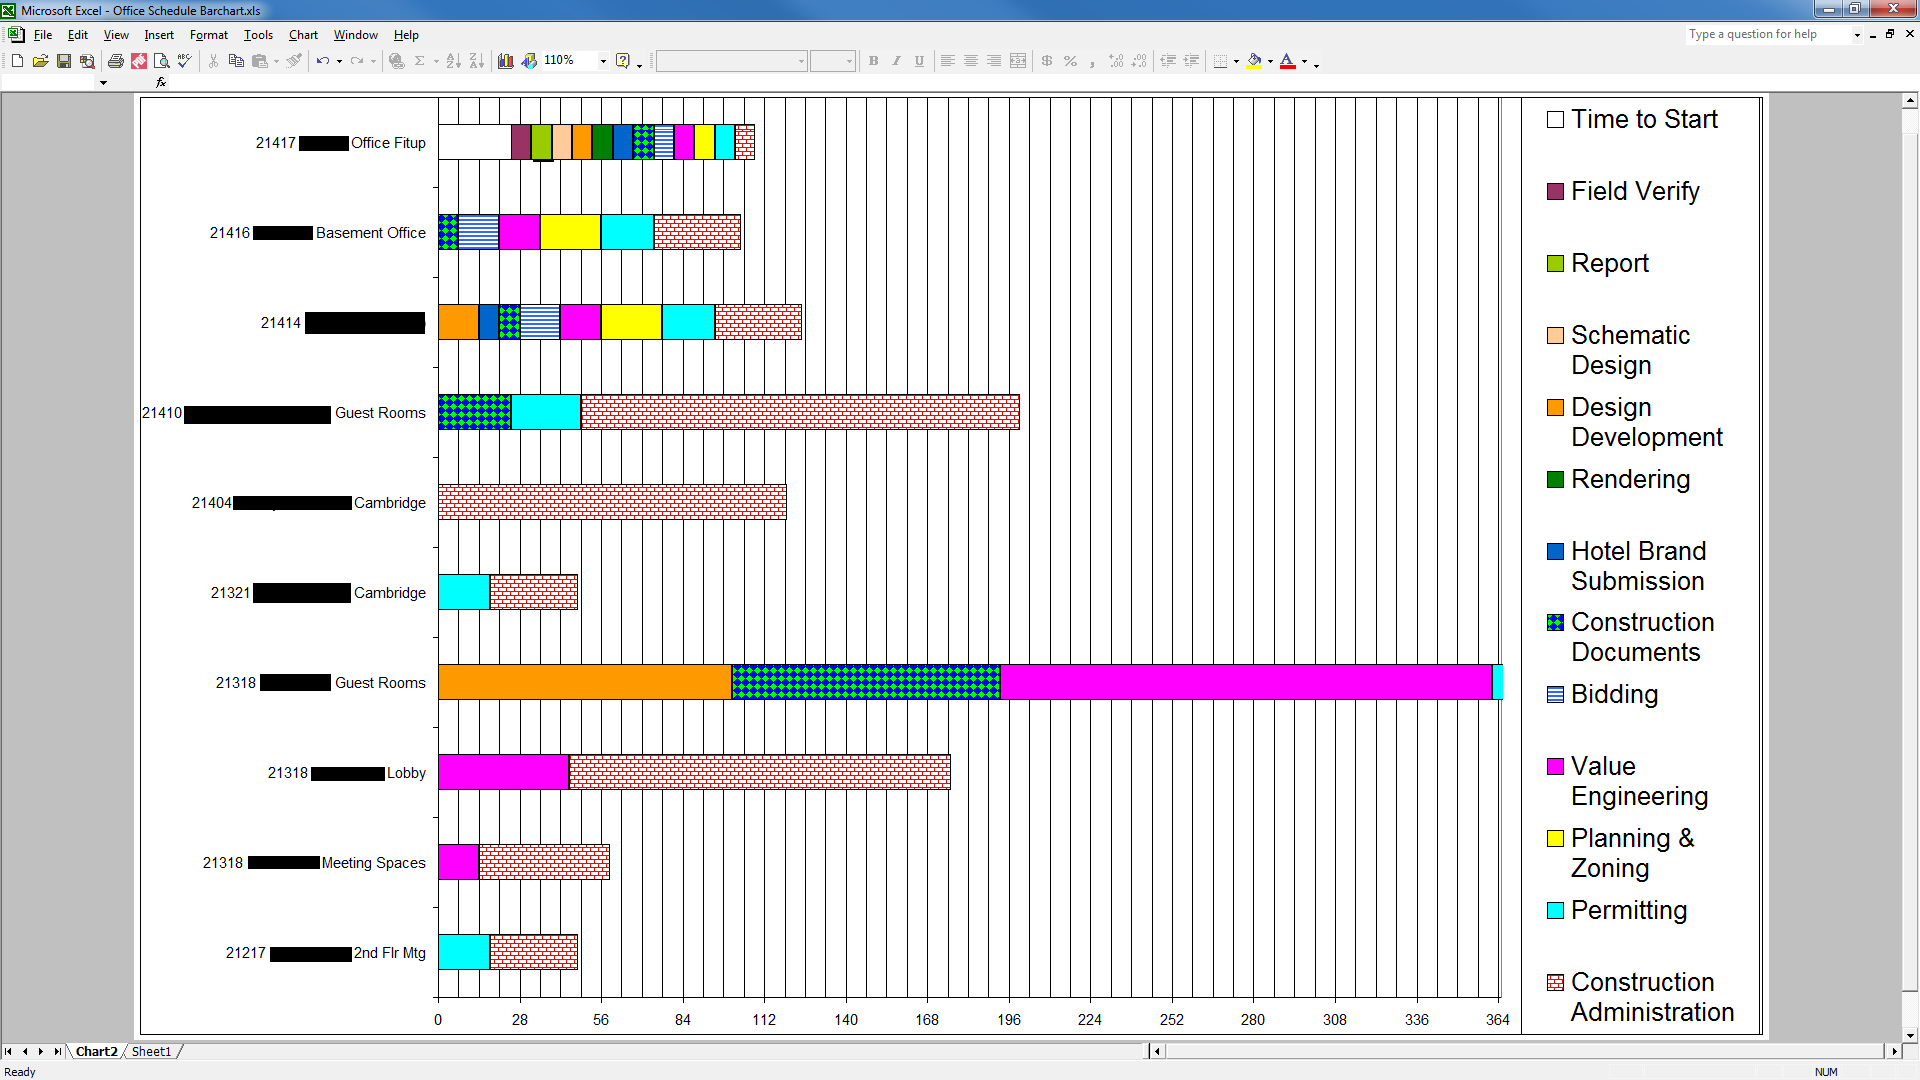
The scale across the bottom is 7 day and 28 day segments. I am not able to get a current set of dates to show there - without having the bars go missing. Other bits that I would have really liked to get working is to have an abbreviation for each phase show inside the corresponding segments - but any that are not used show up where they would come in the sequence, and they overlay each other and/or the project name. The key squares can only be increased in size by bumping up the font.
Oh, and my version of Excel "forgets" the printer I've selected each time I reopen the file, so the formatting gets squished down to 8 1/2 x 11 ...
Does anybody have a better solution for this?